About this case study
Certain details have been anonymized and visualizations reconstructed to respect employer confidentiality. The problems, methods, strategic decisions and experience principles reflect the work performed; proprietary information and unreleased implementation details have been omitted.
The Strategic Shift
People do not arrive thinking in product taxonomy.
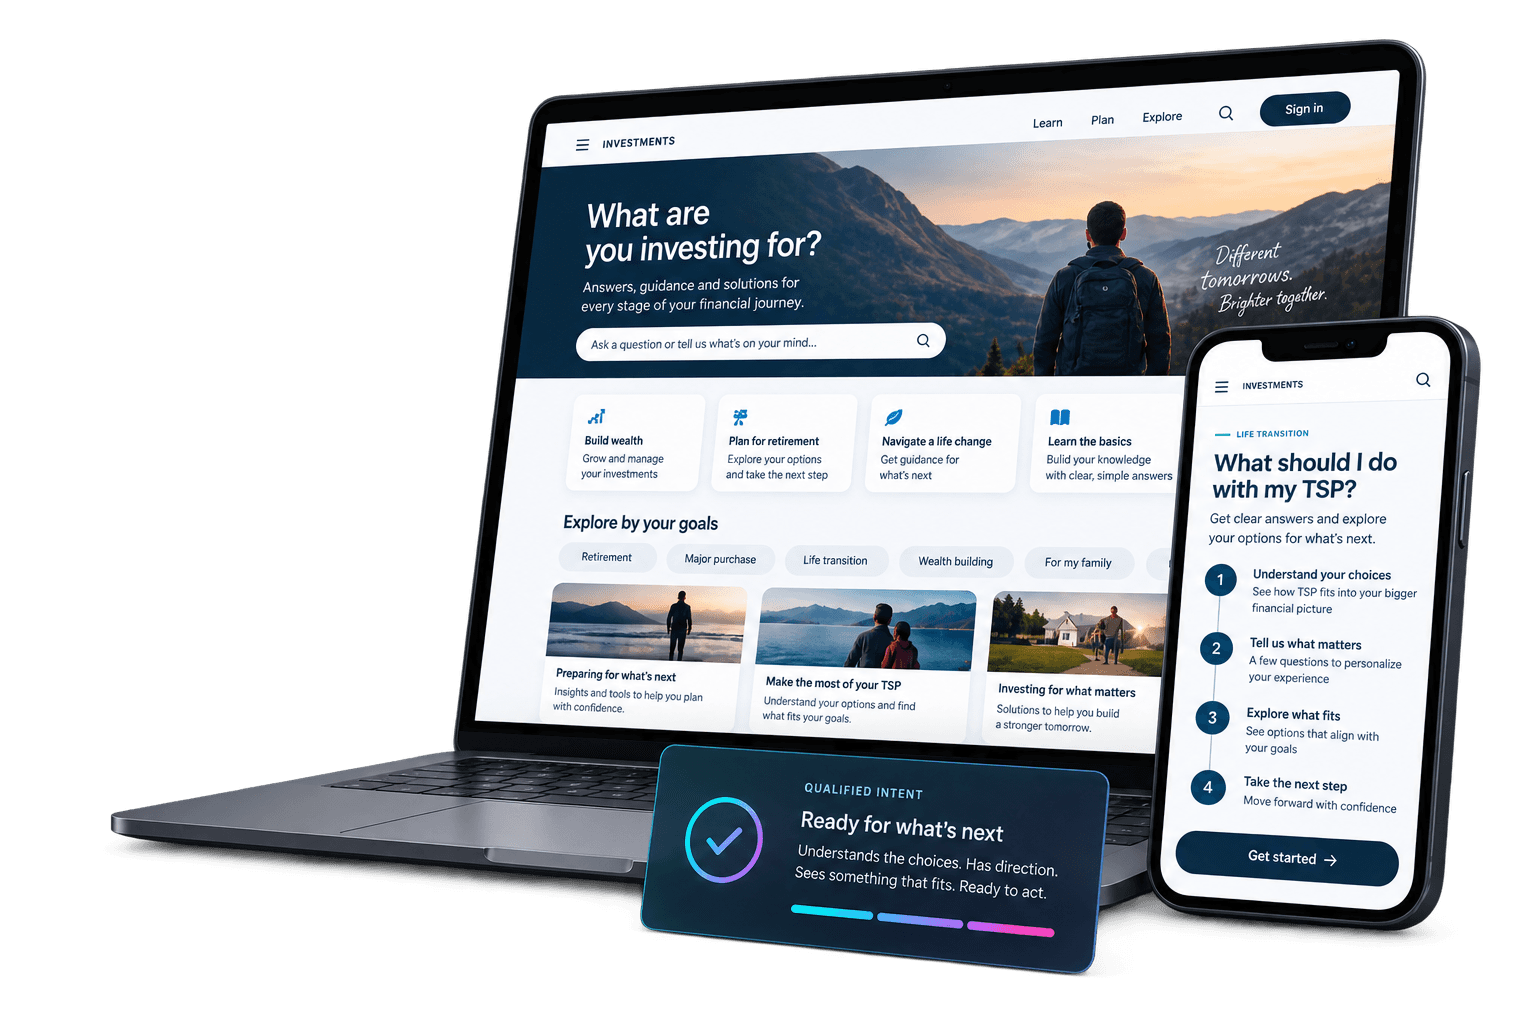
The strategy reframed Investments around the financial questions, needs and life moments that bring people to the experience in the first place.
→
Five deliberate choices
The decisions that change how the destination behaves.
Strategic choices used to guide prioritization, experience design and cross-functional tradeoffs.


Enabling the experience
The experience is only as intelligent as the system behind it.
Context, decisioning and journey state work together beneath the interface to determine what is relevant now and what should happen next.
Measurement
Measure progress,
not just activity.
The measurement model follows the decision journey itself, tracking whether the experience creates the clarity and confidence needed to move forward.
01
Understanding
Do people understand their choices?
Comprehension
02
Direction
Do they know what to do next?
Next-step clarity
03
Fit
Can they identify an approach that fits?
Solution + support fit
04
Qualified Intent
Are they informed, confident and ready?
Readiness
EXPERIENCE SIGNALS
Clarity · Confidence · Fit · Readiness
Explain whether the experience is working.
→
BUSINESS OUTCOMES
Progression → Acquisition / guidance → Funded relationship → Relationship depth
Show where meaningful progression leads.
MODELED BUSINESS IMPACT
Better intent creates
disproportionate opportunity.
disproportionate opportunity.
A benchmark-informed scenario illustrates the potential leverage of moving engaged members from category-median digital action toward top-performing investment experiences.
INVESTING MEDIAN
3.9%
digital-action benchmark
~3.1K
potential relationships
per 100K engaged
per 100K engaged
→
TOP-PERFORMANCE REFERENCE
20.6%
investing digital-action benchmark
~16.5K
potential relationships
per 100K engaged
per 100K engaged
→
POTENTIAL UPSIDE
5.3×
downstream opportunity
+13.4K
additional potential relationships
per 100K engaged
per 100K engaged
ECONOMIC CHAIN
We influence & measure
Qualified intent→Acquisition→Funding→Managed adoption→AUM→Relationship value
Illustrative high-performance scenario, not projected results. External benchmarks represent different stages of the investment decision funnel and are used directionally to demonstrate potential economic leverage. Qualified Intent will be baselined after launch, with downstream attribution measured through acquisition, funding, managed adoption, AUM and relationship value.
Activity ≠ progress.
Clicks and visits describe behavior. Understanding, direction, fit and readiness indicate whether the experience is helping someone make a better-informed decision.
Pre-launch measurement model. Strategic signals and modeled scenarios are not reported performance results.
My Role
I led the system,
not just the screens.
My role was to make the pieces behave like one experience, connecting customer needs, research, strategy, experience architecture, measurement and the operating decisions required to move the work forward.
FRAME
Reframed products around the decisions people were trying to make.
CONNECT
Research, strategy, experience and analytics into one system.
ALIGN
Teams around a shared experience model.
OPERATIONALIZE
Strategy through architecture, measurement and enabling capabilities.
Reflection
The work was not about designing another investments website. It was about creating a system that could turn complexity into increasingly confident decisions.